Aether industries share Q4FY25 results – chemical growth crams
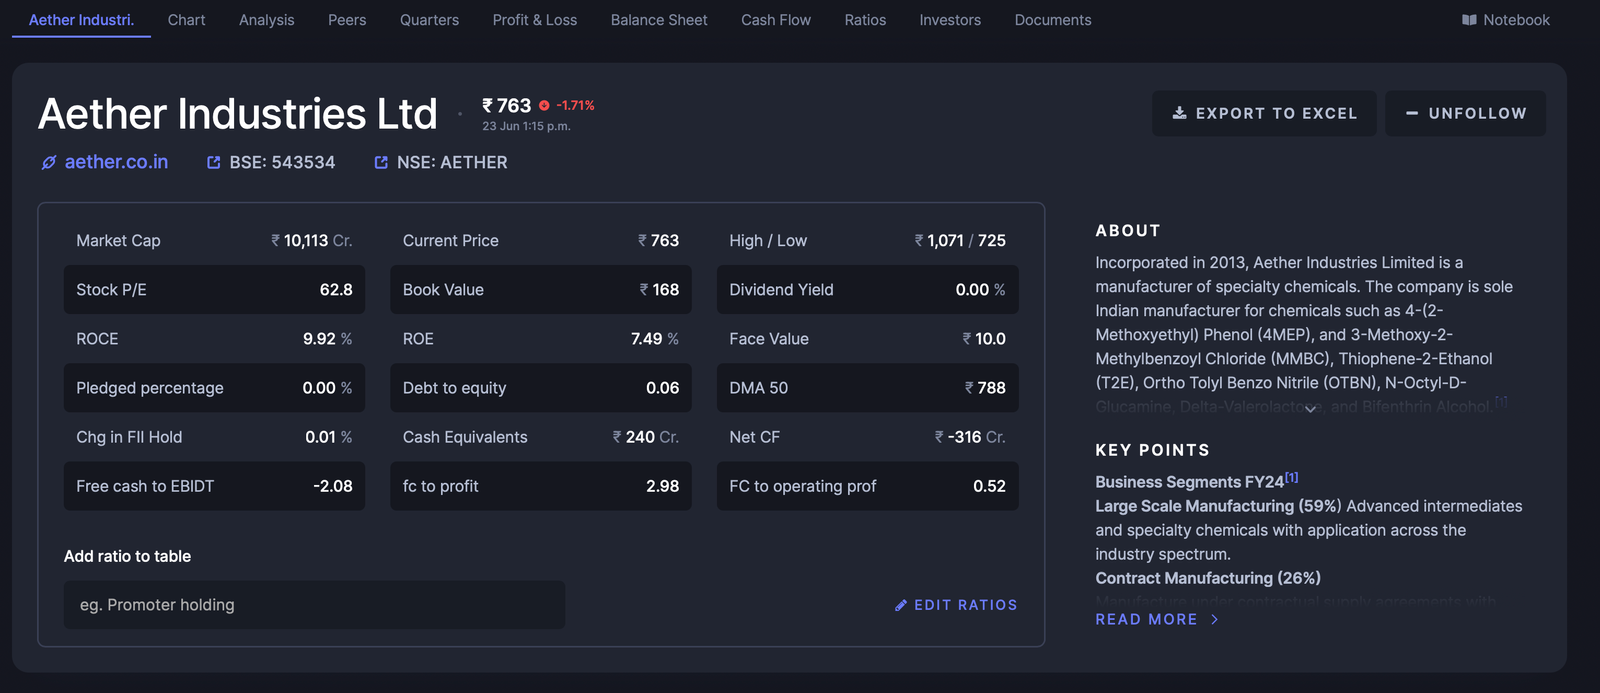
Aether Industries share price while writing this article was Rs 762 on 23 Jun 2025
Currently stock was trading below to its key moving averages and it is in consolation phase. This could be intresting to monitor Q1FY 2026 result and compare with management commentry. Aether industries debut its IPO on 3 Jun 2022. The IPO price was around Rs 700 and from that it made high Rs 1209 in the 22 Jun 2023. From the top stock retraced to the low price of Rs 725 on 21 May 2025 and it is attempting to make higher high higher low. The next result date is 29 Jul 2025 and between this period Aether industries share price should be monitored along with volume.
What does Aether Industries do?
Imagine a company that isn’t making shampoos or biscuits — but is enabling pharmaceutical giants, oil & gas leaders, and material science innovators to create their next-generation products.
That’s Aether Industries — a Surat-based specialty chemical powerhouse. Founded on deep R&D roots and chemical engineering mastery, Aether serves as the chemical brain and manufacturing arm for innovators worldwide.
From a modest start to now commanding attention globally, Aether is one of India’s most exciting players in the Contract Research and Manufacturing Services (CRAMS) and Exclusive Manufacturing (CEM) spaces.
Aether’s Product Segments: Diverse, Deep, and Defensible
Aether’s product mix is where the real magic happens. It operates in three high-value verticals:
1. Large Scale Manufacturing (LSM)
- Focused on import substitution for advanced intermediates in pharma and agrochemicals.
- First-time manufacturers in India for many of these products.
2. Contract/Exclusive Manufacturing (CEM)
- Building long-term, sticky partnerships with global clients, especially in material sciences and oilfield services.
- Example: Dedicated Site-3++ to a material science client.
3. CRAMS (Contract Research and Manufacturing Services)
- High-margin research-to-scale partnerships.
- Over 50 CRAMS projects, 70% of which are non-pharma and non-agro, focusing on innovative materials.
Each business model is synergistic: CRAMS leads to CEM, which scales to LSM.
Where Does Aether Source Its Raw Materials?
Like many specialty chemical companies, Aether sources bulk chemicals, solvents, and reagents — some locally, others globally. However, a few important notes:
- The company focuses on backward integration, minimizing dependency risks.
- It emphasizes cost-efficient, engineering-led process innovation, which often reduces raw material intensity.
- Aether has a low exposure to US markets (7%), shielding it from tariff wars and geopolitical instability.
Risks to Watch
No story is complete without its possible roadblocks. Here’s what could go wrong:
- Client concentration risk (e.g., Site-3+ fully tied to one customer)
- Execution delays in Site-5 or new CEM projects
- Regulatory risks common to the chemical industry
- No inorganic (M&A) strategy yet — may limit sudden scale-up
Aether Is Building India’s Chemical IP Backbone
While most chemical companies are content manufacturing to spec, Aether is building chemical IP, strategic relationships, and long-term trust with global innovators. It’s not just a manufacturer; it’s a partner in invention.
With a sharp focus on R&D, high-margin services, and specialized product development — Aether is quietly but powerfully becoming a global enabler of innovation.
For investors, industry observers, or curious minds — Aether Industries is a stock worth watching, and a story worth telling.
Aether industries Q4 FY2025 stock analysis based on management con call
Current Performance vs. Future Outlook
| Aspect | FY25 Performance | FY26+ Outlook |
|---|---|---|
| Revenue | ₹8,803 million (↑38% YoY) | Strong growth expected from CEM and CRAMS |
| EBITDA | ₹2,709 million (31% margin; ↑72% YoY) | Target ~29–30% margins, potential gradual increase |
| PAT | ₹1,584 million (↑92% YoY, PAT margin ↑ from 13% to 18%) | Consistent PAT margin of ~18% expected |
| Volume Growth | ↑34% YoY | Further growth from new plants and client additions |
| CRAMS & CEM Contribution | ~48% of total revenue | Target 70% revenue share |
| Inventory/Debtor Days | Inventory ↓ to 173 days; Debtors ↓ to 126 days | Targeting working capital cycle ~150 days |
Aether Industry MD’s Strategic Mind Map (Dr. Aman Desai)
| Strategic Pillar | Key Focus |
|---|---|
| R&D | Core driver with ₹681 million (~8% of revenue); doubling capacity |
| CRAMS & CEM | Shift to high-margin, scalable partnerships in non-pharma/non-agro |
| Diversification | Target split: 25% each for pharma, agro, material sciences, oil & gas |
| Sites as Strategy Anchors | Site-1 (R&D), Site-3+ (material sciences), Site-4 (oil services), Site-5 (future growth) |
| Global Partnerships | Emphasis on exclusive deals and scale-up from CRAMS to CEM |
Expansion, Capex, New Products, Inorganic Growth
| Category | Details |
|---|---|
| New Products | 50+ CRAMS projects; multiple material science & oil-field molecules |
| Expansion Plans | Site-1 (R&D expansion), Site-3+, 4, and 5 (Panoli) ramp-up |
| Capex | Land purchase ₹420 million; high R&D infra (e.g., NMR equipment ₹8 Cr) |
| Inorganic Growth | None explicitly mentioned; focused on organic partnerships |
| Factory Expansion | Site-4 commercialized, Site-5 (46 acres) to house 3–4 new plants |
Margin Expansion Factors
| Factor | Impact |
|---|---|
| Shift to CRAMS & CEM | High-margin model, now 48% of revenue; target is 70% |
| Solar Power Cost Saving | ₹188 million savings (vs ₹172 million in FY24) |
| Site-level Ramp-up | Efficiency from Site-3+ and Site-4 scale-up |
| R&D Innovation | Proprietary products/processes for clients |
| Operational Efficiency | Working capital cycle optimization, lower energy cost |
Risks & Management Missteps (What Could Go Wrong?)
| Risk Factor | Commentary |
|---|---|
| Over-dependence on select clients | Heavy investments in dedicated sites (e.g., Site-3+ for one client) |
| Execution Risk on Capex | Site-5 is a large and phased project; delays could impact scale-up |
| Global Macro Factors | Although US exposure is just 7%, Chinese aggression elsewhere could impact pricing |
| Working Capital Discipline | Target of 150 days; needs consistent execution as CEM scales |
| Lack of Inorganic Growth Strategy | No clear plan for acquisitions; could limit rapid scale-up |
| Regulatory or ESG hurdles | Chemical industry subject to compliance risk |
| Metric | Current Performance (Q4 FY’25 / FY’25) | Future Aspects (FY’26 and Beyond) |
|---|---|---|
| Revenue | Q4 FY’25: ₹2,453M (8% QoQ growth from ₹2,333M in Q3 FY’25) FY’25: ₹8,803M (38% YoY growth from ₹6,374M) | Expected to sustain ~₹230-240 crores quarterly run rate, with potential for 18-20% CAGR over 3-4 years. |
| EBITDA | Q4 FY’25: ₹819M (33% margin, up 8% QoQ) FY’25: ₹2,709M (31% margin, 72% YoY growth) | Target average EBITDA margin of 29-30%, with gradual growth to 33% in a couple of years. |
| PAT | Q4 FY’25: ₹504M (21% margin, 16% QoQ growth) FY’25: ₹1,584M (18% margin, 92% YoY growth) | Expected to maintain ~18% PAT margin, with growth driven by CRAMS and CEM contributions. |
| Volume Growth | Q4 FY’25: 21% QoQ FY’25: 34% YoY | Continued volume growth expected, especially from Site-4 and Site-5 ramp-ups. |
| Revenue Mix | Q4 FY’25: 38% CEM, 10% CRAMS, 51% LSM | Target: 70% CRAMS + CEM, 30% LSM by FY’26 or beyond. |
| Working Capital | Inventory: 173 days (from 210 days) Debtor: 126 days (from 142 days) | Target to reduce to ~150 days in 2-3 years, driven by higher CEM/CRAMS share. |
| Return Ratios | FY’25: ROE 7.12% (from 4%), ROCE 8.5% (from 4.7%) | Expected to improve with better working capital and higher-margin CRAMS/CEM businesses. |
| R&D Investment | FY’25: ₹681M (8% of revenue) | Minimum 6-6.5% of revenue to be invested in R&D, with doubled R&D capacity by FY’27. |
| Sustainability Initiatives | Solar power benefit: ₹188M in FY’25 (up from ₹172M in FY’24) | Expansion of solar/wind/hybrid renewable energy models for new sites. |